Great information bleow copied from: http://web.cortland.edu/andersmd/STATS/valid.html
Reliability is another term for consistency. If one person takes the same personality test several times and always receives the same results, the test is reliable.
A test is valid if it measures what it is supposed to measure. If the results of the personality test claimed that a very shy person was in fact outgoing, the test would be invalid.
Reliability and validity are independent of each other. A measurement maybe valid but not reliable, or reliable but not valid. Suppose your bathroom scale was reset to read 10 pound lighter. The weight it reads will be reliable(the same every time you step on it) but will not be valid, since it is not reading your actual weight.
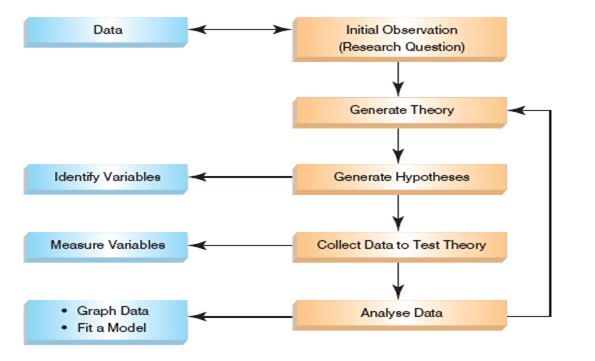
The Research Process
Population
Think, "parameters." The collection of units (be they people, plankton, plants, cities, suicidal authors, etc.) to which we want to generalize a set of findings or a statistical model.
Sample
Think, "statistics." A smaller (but hopefully representative) collection of units from a population used to determine truths about that population
–Used to make inferences about a population
Descriptive stats/Summary Statistics
– Measure of central tendency
– Dispersion
– Shape of the distribution
Bias
– How it affects our analysis and how to reduce it
Confidence Interval (of the mean for ease of explanation)
- Using sample data, we estimate a range within which we expect the population mean to fall
– Point estimate plus and minus a margin of error
– If we took every possible combination of sample size XX and calculated a 95% confidence interval for each, 95% of the time, the population mean would fall within the
Null Hypothesis Significance Test
– Assume nothing is going on (null hypothesis)
– What do you expect to get if something is going on (alternate hypothesis)
– What is the level of risk of a Type 1 Error are we willing to accept? (Type 1 – rejecting the null hypothesis when it is, in fact, true)
– Based on the level of risk we are willing to accept, we’ll calculate the critical value(s) to establish the boundary for our rejection region(s)
– What did we get with our one little sample?
• Calculate the sample statistic and compare it to the critical value(s)/rejection region(s)
• P value approach – the p value is the actual probability of obtaining the observed sample or a more extreme sample if the null hypothesis makes a true statement about the population that was sampled
– “If the p is low (er than the chosen significance level), the null must go” –If what we got was very unlikely, call baloney on the assumption that nothing is going on
Comparing Means
– t-tests
• limited to 2 groups
• Inflates the error rate: familywise error = 1 – (0.95)n
– ANOVA •Can do multiple groups while controlling the familywise error rate based on our chosen significance level
Correlation Analysis
– Strength and direction of the relationship/association between 2 variables
Simple linear regression
– Provides prediction/estimation of the outcome (dependent) variable based on the predictor variable
– Outcome variable has to be interval or ratio level data
– Check assumptions
Multiple Linear regression
–Predict an outcome variable based on several predictor variables
–Looks at all the independent/predictor variables simultaneously
Logistic regression (binomial or multinomial)
–Predicting a categorical outcome/dependent variable from a set of predictor variables
